About the Customer

Our client is a leading trading exchange in India. They offer a variety of trading products and commodities, including Intra-Day, Reverse/Forward Auction, and Standard Auction.

The client provides 24/7 trading for end-users, ensuring high liquidity even at midnight and 100% accuracy in processing times.

Project Details

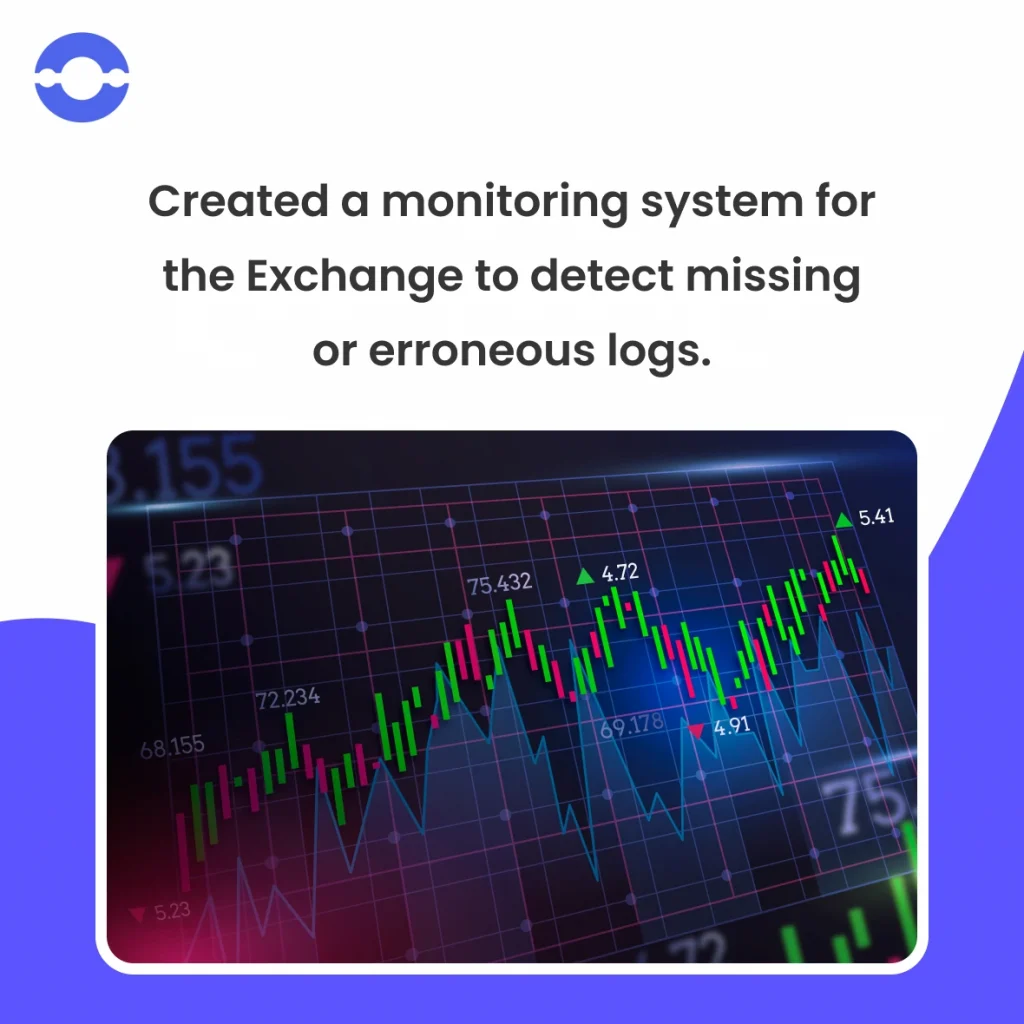
BigOhTech was responsible for setting up a monitoring system for the exchange. This system was designed to capture logs from various systems and issue alerts if any logs were missed or if error logs were reported.

Exchange Monitoring Setup

Industry

Energy

Technologies

Prometheus, Kubernetes, AWS, Grafana

Problem

  • They had a Kubernetes cluster setup with nodes in each cluster. They wanted to monitor the health of individual nodes and clusters.
  • The client desired a monitoring mechanism to notify stakeholders in near real-time about any failed logs and their previous resolution steps. The client had to comply with regulatory requirements to ensure all logs were captured and there was no system downtime.
  • The client’s workflow was divided into several stages, each with a predetermined grace period. They requested notifications when a particular step’s grace period was about to expire. Due to the nature of trading, each activity had to be completed within a specific timeframe, with even millisecond delays triggering a warning or failure notification.
  • They wanted to achieve network monitoring at the network layer, including switches and virtual machines running the applications. They also needed application monitoring for both server-side and client-side apps, such as an Angular client-rendered app and a mobile app.
  • The client was keen on tracking network traces for the end consumer to identify API latency, heartbeat, and API service maps to understand the time taken for interactions with different microservices. They also wanted to determine the turnaround time for specific operations using logs from the consumer-facing application.
  • The client required a unified platform to view the health and metrics (such as slow query logs and CPU utilization) of multiple products. Incident mapping and tracing were essential for better root cause analysis (RCA) to identify when similar incidents occurred in the past.
problem
Our-Approach

Our Approach

  • With Promtel, we monitored Kubernetes and its clusters. Loki was used to capture logs triggered by applications on both the server and client ends. Business rules were set, and once the grace period expired, notifications were sent via Teams.
  • We configured team connectors in Grafana to send notifications and created a group where notifications were delivered. A well-defined log structure was created, with Loki capturing the logs and custom code handling the log types (e.g., triggering notifications for 4XX or 5XX API responses).
  • Prometheus was used for application and network monitoring, capturing logs from both the consumer and infrastructure ends. This allowed us to view the end user’s network trace, including API latency and service maps, and to see the time taken for workflows to complete.
  • Grafana was used to plot charts and graphs, linked to various data sources. A unified dashboard depicted the health of various products using line graphs showing slow query logs, CPU utilization, etc. This setup enabled real-time monitoring, with no delay and immediate triggers.
  • The client could view the turnaround time for specific activities, as network traces for consumer machines were recorded in real-time on remote dashboards. Zipkin tracked the API service map, API latency, and communication times with other microservices. Incident mapping reports and logs for repetitive instances allowed the operator to quickly arrive at solutions.
  • For security, edge security measures and OWASP Top 10 practices were followed. Promtel enabled teams to easily see the health of each cluster and node on the dashboard.

Benefits

  • The client successfully passed the audit conducted by the regulatory body in just two attempts. 
  • System downtime incidents were virtually zero. 
  • Trade loss was less than 1.5% due to timely notifications and alerts.
Benefits

Build It Faster and Smarter with Our Agile Development Process

BigOhTech’s expertise in transforming trading operations with cutting-edge solutions can help businesses like yours build effective tech solutions.