Both Tools Grafana vs Kibana are data visualization platforms allowing users to visualize data with dashboards. Kibana is especially used for doing Log monitoring and analysis. While Grafana is a visualization tool helping developers to understand metrics through charts and graphs.
In this guide, we will take a closer look at Grafana vs Kibana and which one is more suited for your needs.
Grafana is an interactive visualization tool used to create charts and graphs and helps users to understand metrics.
Grafana can be expandable through plugins. It allows the developers to create, access, and share dashboards with their team members.
Grafana is an open-source platform that enables developers to visualize data. Grafana deals with time series data in various charts, graphs, and histograms and can be integrated with several data sources such as graphite, elastic search, MySQL, Prometheus, etc.
Besides that, This data visualization platform offers 3 versions: Grafana Cloud, Grafana open source, and Grafana Enterprise.
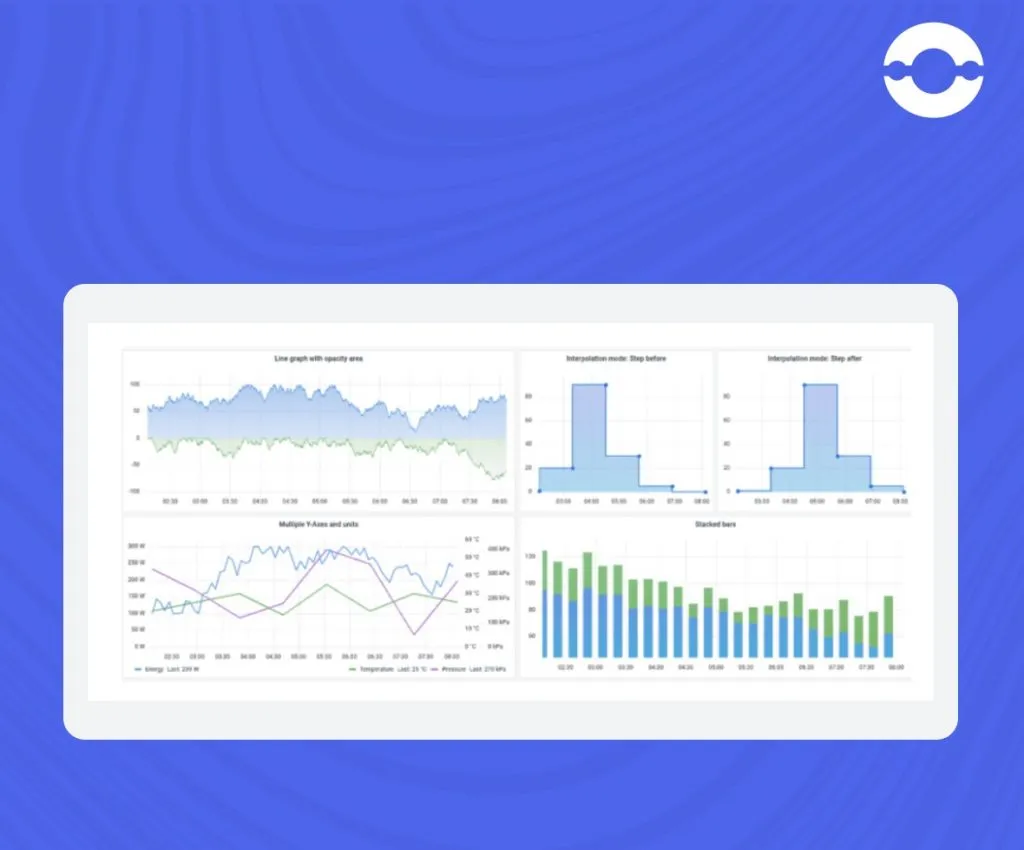
Grafana offers users many visualization options, helping developers understand the data through time series, bar charts, histograms, geo maps, etc.
Grafana supports a variety of data sources such as graphite, Elasticsearch, MySQL, Prometheus, Influx DB, Loki, Tempo, etc. For dealing with time series data
Grafana allows users to bring their data together in the same dashboard because it has support from dozens of databases
As Grafana has an inbuilt alert system, it is used to raise alerts for metrics. For example – Developers can set alerts when the memory utilization exceeds a certain limit, which would help the operations team resolve the issue.
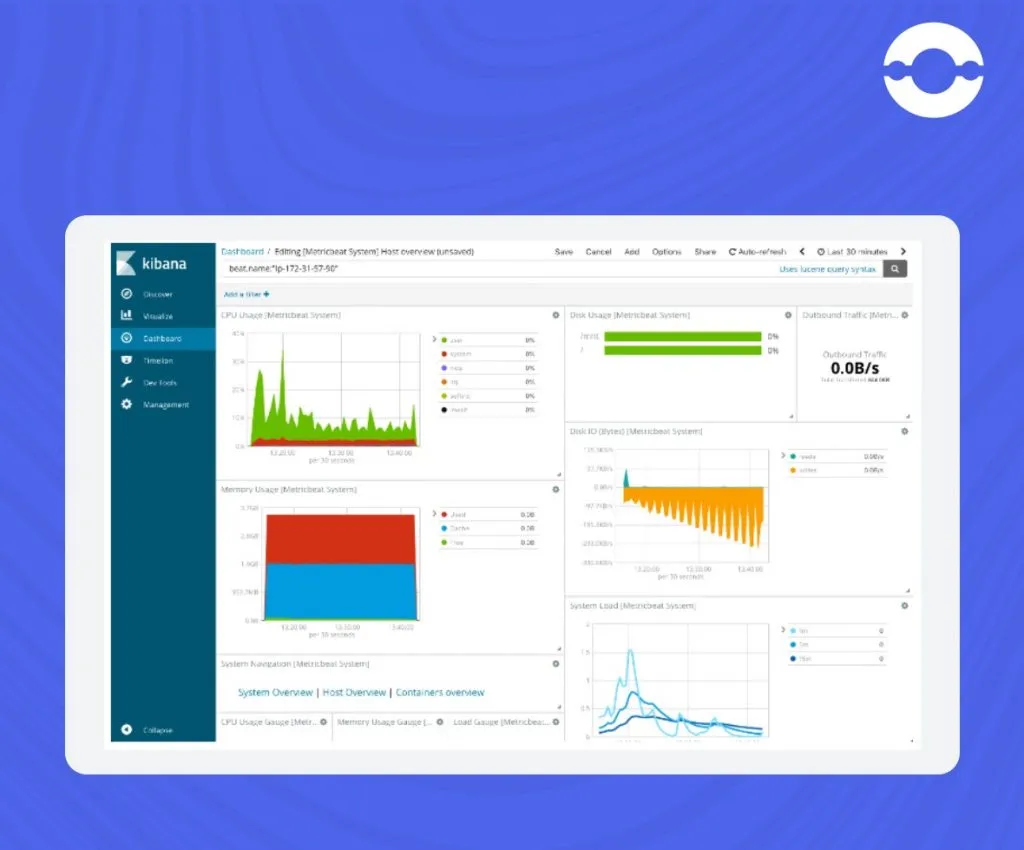
Kibana was established in the year 2013. Kibana is a data visualization system used for querying and log analysis. This is an open-source visualization tool built on the elastic search to analyze logs, such as how many errors have been accessed in log files.
It allows the developers to search data indexed in Elasticsearch and access visualization features provided by the Kibana dashboard.
Kibana supports integration with Elasticsearch and does not support any type of integration.

Grafana allows the operations team to create and manage alerts when they are raised. Grafana has its inbuilt altering UI where developers can set the predefined criteria for whether an alert should be raised or not.
Kibana is mostly suited for log analysis. Moreover, It cannot create and manage alerts directly, as it depends on 3 party integration to raise alerts.
Grafana offers developers many customization options using panel editors, allowing users to play with the x and y axis, panel colors, etc. It allows you to create interactive dashboards by integrating data from multiple sources. This is built for cross-platform visualizations to support graphs, heatmaps, tables, free text panel types, etc.
Kibana dashboards are dynamic, allowing users to filter the data on the go. Additionally, Kibana allows you to create various visualizations from pie charts, line graphs, data tables, and geographic maps. Not only this, but it does offer other types of visualizations as well:
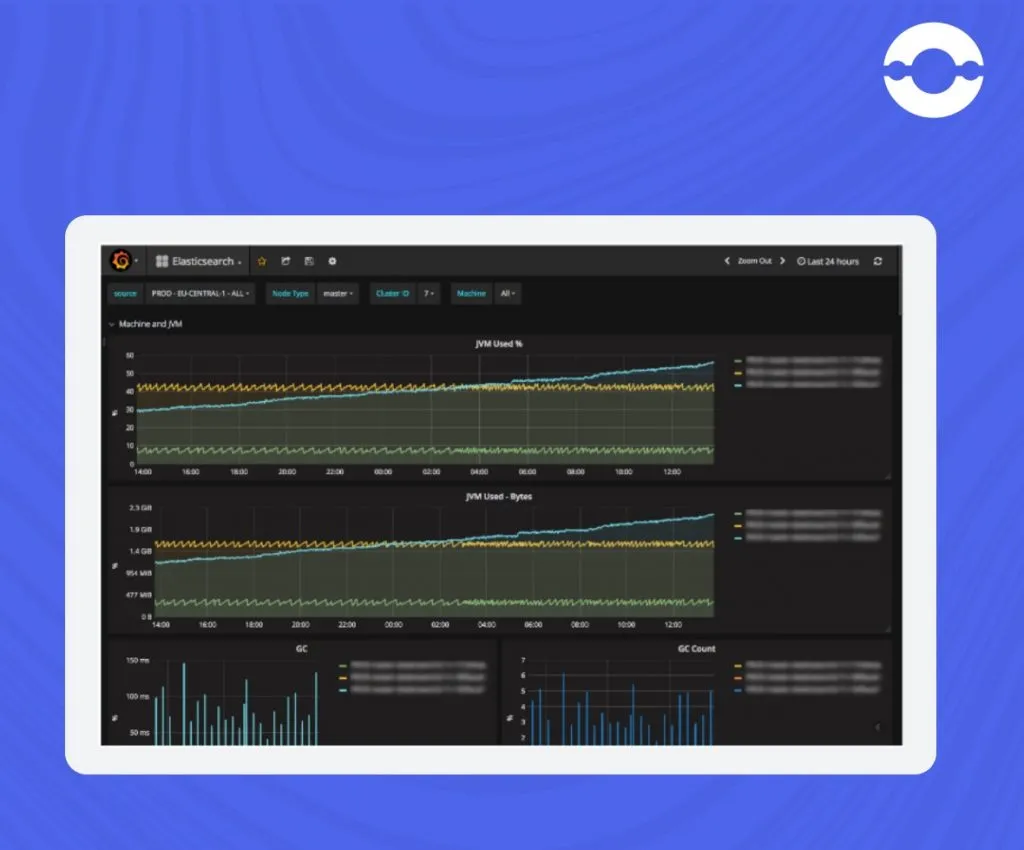
Grafana is highly suited for analyzing metrics (numeric information) such as CPU utilization over the period, server-generated heat, I/O utilization, and memory disk.
Kibana is suitable for doing log analysis, such as how many errors have occurred in the log file.
To access the Grafana monitoring tool, you must ensure it works well on Windows, Mac OS, and Linux. You can download Grafana by going to the Grafana website and following the instructions.
On the contrary, if you want to download the Kibana monitoring tool, you can visit the Kibana website. Kibana is challenging for the user to set up as the user has to install separate ELK (Elasticsearch, Logstash, and Kibana) packages first.
Grafana is an open-source framework that is free for anyone to use. However, Grafana has a product called Grafana Cloud. And, Grafana Labs powered Grafana cloud, Grafana cloud comes with three packages: Free, Pro, and advanced.
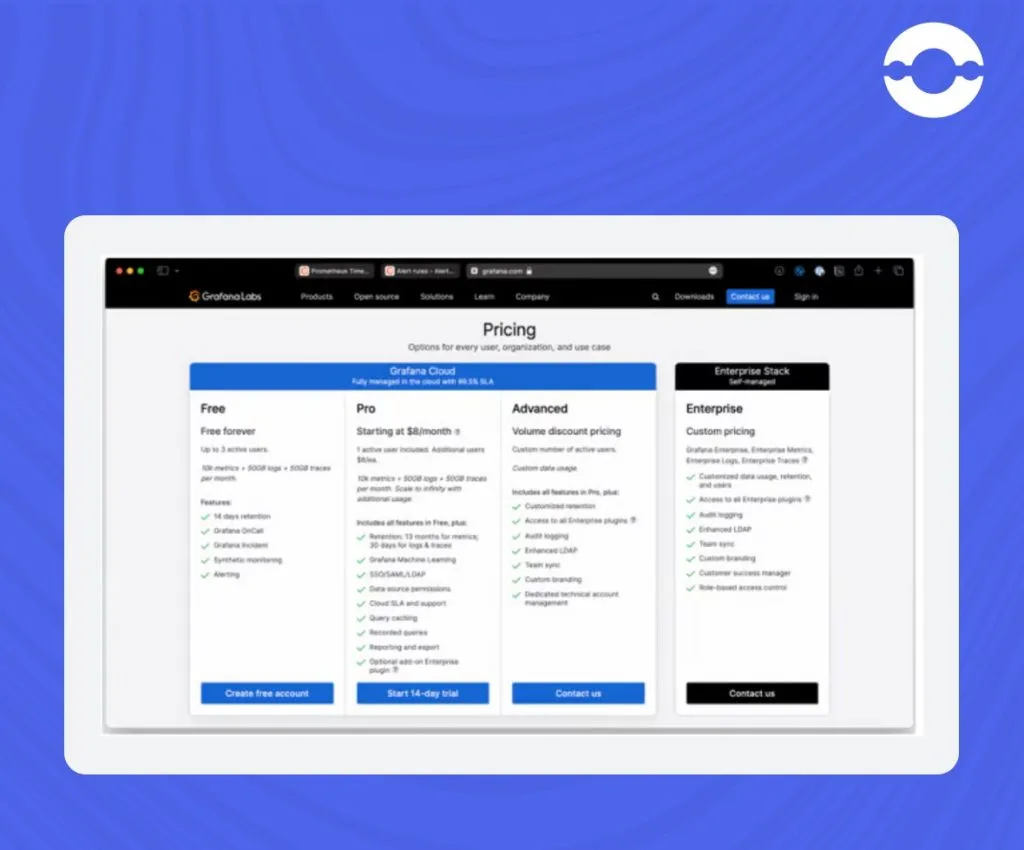
The pro tier is usually for smaller enterprises, costing $8 monthly. In contrast, the advanced version is for large enterprises.
On the contrary, if you want to access the Kibana visualization tool, you must buy an entire ELK stack that offers various packages for its customers. These packages involve standard, gold, platinum, and enterprise. The most affordable plan for the user starts at $95 per month.
Grafana and Kibana have a strong community. However, if you watch GitHub, you will see that Kibana has comparatively more code commits than Grafana.
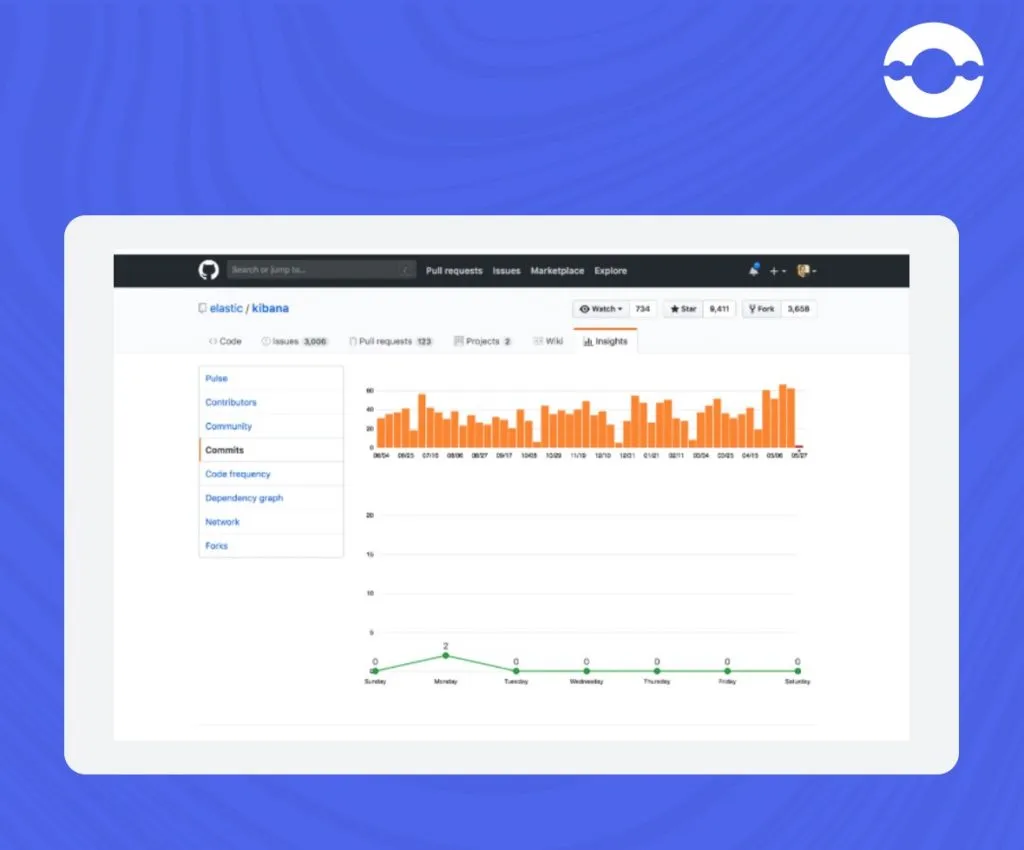
Grafana has over 15,000 code commits, while Kibana has more than 17,000.
Kibana has immense community support for users because it is the oldest monitoring tool. Grafana replicated Kibana and came up with launching more features. Though Grafana has more customization features, in terms of Community support, Kibana outperforms the best.
Grafana is more focused on data visualization. It has an interactive user interface.
This platform divides its user interface into two parts. Moreover, The left side of the Grafana tool comprises navigational links, and the right side of the dashboard allows users to create dashboards, configure settings, etc.
Kibana focuses on data exploration and analysis. It has a powerful search system that gives an advantage to the users to dig deeper into data and get insights. Some users find Kibana complex because it displays logs in text format despite its clean interface.
The UI/UX design of Grafana outperforms the best because it has a simple UI/UX design backed with more customization options. If anyone is looking to create interactive dashboards, then Grafana would be the go-to option for you.
Now, you get a clear idea about Grafana vs Kibana. If you would ask us, “Which is the best monitoring tool for visualization”. So, The answer is completely subjective.
If you want a monitoring tool that is suitable for log monitoring, then Kibana would be the perfect choice for you. However, if you want to create an interactive visualization tool to track metrics then go for Grafana.
Q1.Is Grafana free or paid?
Grafana is an open-source visualization tool that is available for free. However, Grafana Cloud offers 2 packages: Grafana Pro and Grafana Advanced.
Q2.Which data store is best for Grafana?
Prometheus datastore is best for Grafana. Prometheus acts as the hub for data storage. Moreover, A time series database used for monitoring is Prometheus.
Q3.Which is better, Kibana or Grafana?
Grafana is highly suited for analyzing metrics, creating and managing alerts, and analyzing logs through LOKI. On the contrary, Kibana is best for monitoring logs. So, If the user is looking to create interactive dashboards, Grafana outperforms best. However, If the user has a prime objective of doing data exploration and analysis, then choosing Kibana would be profitable.
Q4.Can Kibana replace Grafana?
Kibana and Grafana are both popular visualization tools for monitoring and analyzing data, but they have different strengths and use cases. While there may be some overlap in functionality, it’s not necessarily accurate to say that Kibana can completely replace Grafana or vice versa.
Q5.What are the limitations of Kibana?
1. Firstly, Kibana is a powerful data visualization tool, but like any software, it has its limitations. Here are some limitations of Kibana: 2. Limited Data Processing Capabilities 3. Requires Elasticsearch 4. Limited Visualization Types 5. Limited Security Features 6. Limited Customization Options 7. Not Suitable for Complex Data Analysis
Q6.What is the limitation of Grafana?
Grafana has a limitation where it doesn’t have a native capability to aggregate data from multiple sources as it isn’t a data store of its own which leads to the limited ability to handle correlation across multiple data types.
•
Tech Architect•
Articles