Logging records detailed, timestamped events (like errors, user actions) inside an application to help developers understand what happened and when. It's useful for debugging and finding root causes.
Monitoring tracks system health in real-time using metrics like CPU usage and error rates. It helps detect performance issues early and alerts teams before problems affect users or cause downtime.
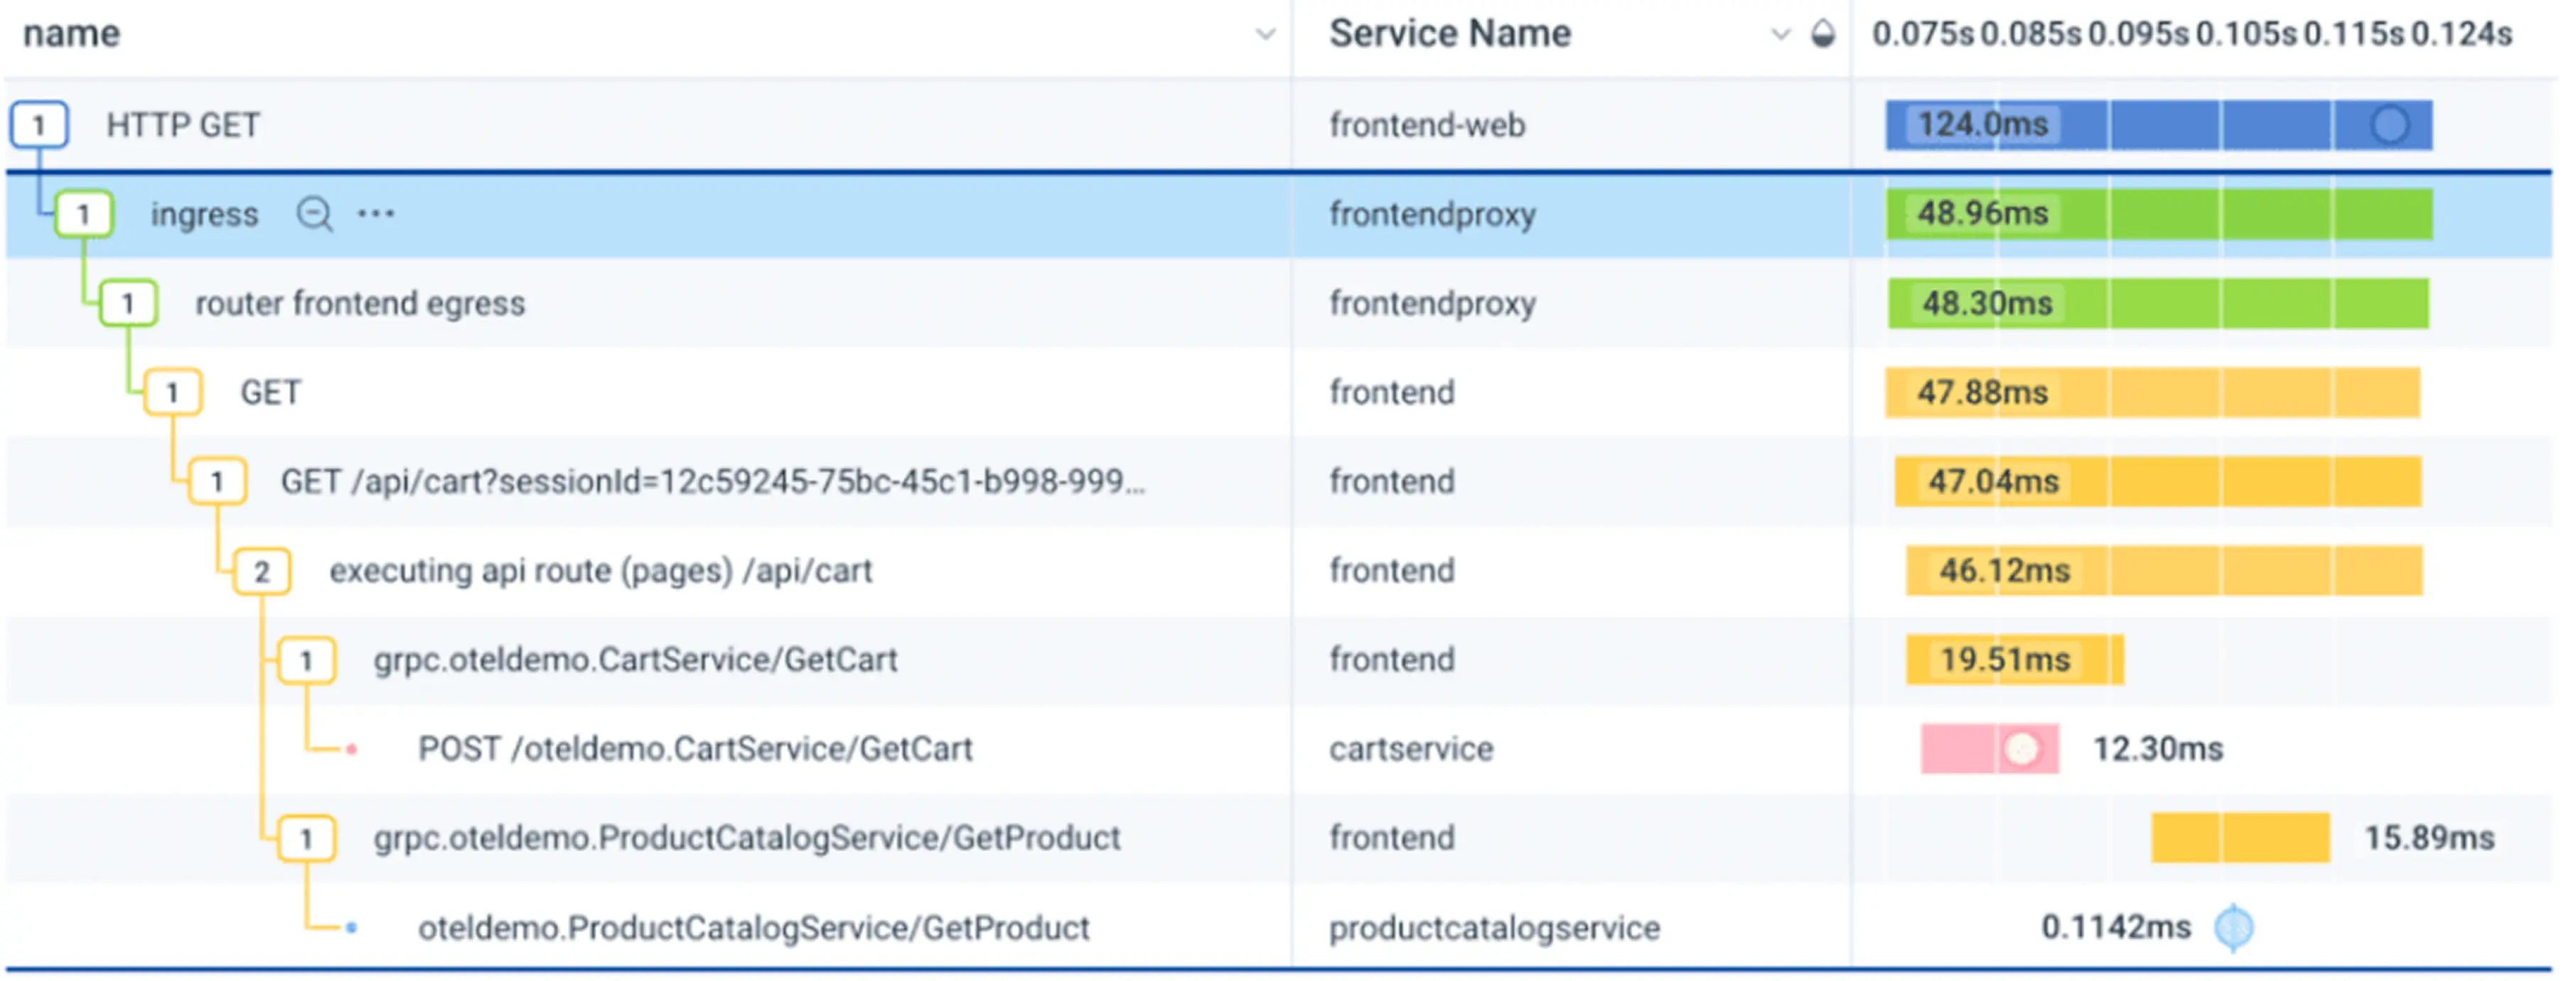
Tracing follows the path of a request across multiple services to show where and why delays or failures happened. It's especially useful in complex systems like microservices.
Key Differences: Logging = What happened, Monitoring = When and how it happened, Tracing = Where and why it happened
All Three Are Essential: Together, logging, monitoring, and tracing give full visibility into system performance, speed up issue resolution, and improve user experience. Tools and strategies need to be continuously updated for the best results.
BigOhTech boosts release speed and modernizes legacy systems with full-stack observability backed by proven DevOps expertise and real results.
You developed a fintech app and found that the app was glitching, costing users a minute—each minute of downtime results in failed transactions and frustrated customers. One day, you tried figuring out whether the app is overly complex or what's happening under the hood.
You checked your logs to find the individual errors stamped with timestamps ("Payment timeout at 14:03:22").
Next, you check your monitoring dashboard and find a spike in response time and CPU usage. Tracing provides you with a full storyline by tracking each transaction from login to failure.
Result? By tracking the customer's journey from login to making a purchase, you fix the issues fast before customers even notice them. This saves you lost revenue and reputation.
In this blog, we'll talk about how logging differs from tracing and monitoring.
Difference Between Logging, Monitoring and Tracing
Basis of comparison
Logging
Monitoring
Tracing
Meaning
Recording detailed system events (errors, actions).
Observing system health and metrics in real time.
Tracking the flow of requests across services.
Objective
Diagnose issues and capture what happened.
Detect and alert on performance or availability issues.
Understand request paths and identify latency/failures.
Focuses on WHAT
What happened.
When and how it happened.
Where and why, it happened.
Data collection
Logs (textual event records).
Metrics (CPU, memory, disk, network).
Request flow data.
Usage
Troubleshooting, debugging, compliance.
Monitoring is used to identify bottlenecks before they could impact on the system’s performance.
Pinpointing bottlenecks in distributed systems.
Use cases
Server crash analysis, application error debugging, compliance auditing.
Proactive alerts for CPU overutilization, identifying system outages.
Microservices request tracking and latency analysis.
Visualization
Text based format
Dashboards and graphs.
Flow diagrams
Tools
These include ELK stack, Splung and gray log.
Tools used for monitoring include Nagios, Datadog ,Grafana, Kibana, etc.
Tools used for tracing include Zipkin, Jaeger, etc.
When to choose?
Detailed records and troubleshooting
Ongoing system health checks and alerts
For understanding end-to-end request flow in distributed systems.
What is Logging?
Logging is the act of recording timestamped events from your applications/systems—everything from user actions.
It helps developers and system admins to know what happened, when it happened, and why it happened. The log is simply data that generates what occurred inside your application, such as "User login failed".
When a user performs various tasks on an application, logging keeps a timestamped record of everything in a file called a log file. These include details such as user action, login search, item purchased, or an error.
Consider a case when a user opens a Facebook application and crashes. The user is unaware of what happened behind the scenes. However, the administrator can see the log files and find the root cause where the things broke down.
While creating logs, it's easier to go with structured logs format as they're machine-readable and easier to analyze and diagnose issues. A structured log provides information about the timestamped record, log level, and event data.
Unstructured logs, on the other hand, can be an expensive liability for your business when the system goes down.
While logging is great for finding out the root causes and troubleshooting problems, the presence of voluminous amounts of data makes it challenging to search through.
Why is it important to do logging?
Analyzing logs constitutes an important aspect for software developers as it helps them with
At the time of debugging, developers can check log files to see what happened in the system that caused an error.
Log statements make troubleshooting quick and easier as developers know how to fix broken things and what caused the error, say payment failed at 3:04 PM due to timeout issues. The more quickly you can fix issues, the fewer customers will be impacted.
When systems crash or anything goes wrong, logs become the first source for finding the exact cause of the problem.
It makes the system secure from suspicious activities or threats such as failed login attempts, system alerts, etc.
Get insights into how software is performing, how many resources (memory and CPU) the application consumes, and what operations are performed in the system.
Improve the user experience by providing insights on how they interact with applications and whether they are experimenting with new features or not. This helps you add the features that customers love adopting.
Track the user flow and pinpoint the exact location where the user took a specific action.
Monitoring is about collecting and visualizing metrics of system health (CPU, memory, request latency, error rates).
Just like logging, monitoring is also an important pillar of observability.
Generally, monitoring is the next step after logging and it’s useful for alerting developers about anomalies such as high response times or increased 5xx errors.
Why is it important to perform monitoring?
Monitoring gives teams' immediate visibility into system health and performance, identifying slowdowns or errors in real time so problems can be spotted and fixed before they grow.
This instant insight means issues are caught and resolved quickly, resulting in reduced downtime and lost revenue.
Monitoring also shows where resources are underused or wasted, helping teams' trim capacity and cut unnecessary costs (many organizations save around 15–20% by optimizing their infrastructure).
By continuously watching for unusual activity, monitoring detects security threats early and lets teams intervene before minor issues become major breaches.
Note:Rely on Monitoring when you want to catch performance issues early.
Example of proactively monitoring
Suppose you are running an e-commerce application and you have 100 servers running in the non-peak hours, and you see your CPU and memory utilization in the peak hours is below 20 per cent.
This means that you have the server idle, which can be terminated, and you can save money.
Real-life example: How does Khris save $1500 through application monitoring?
“
Khris Steven, Founder of Khris Digital says
Logging, monitoring, and tracing are non-negotiable elements for me. When building out a system that touches revenue, I looked at logs to see where I catch things that nobody sees – webhook failures, and botched form submissions etc.
At the time of launching the course, I found that the webhook was not sending leads to our system. Our team fixed that issue and saved $1500 in lost revenue.
My approach is to fix those logs into app-level actions and system-level health. This way, I can pinpoint where the problems arise from.
I set up monitoring anything related to traffic or transactions. For instance, there was a checkout page that slowed down and found some issues using Datadog.
Result? 22% increase in conversions in just 48 hrs.
”
What is tracing?
Tracing is about understanding how requests flow through various services in an application.
It's like following a path to a system, e.g., service A → B → C) and tracking how long a request takes when it flows across different parts of an application.
It exactly shows the location of delays or mistakes. Consider a scenario where it feels that everything looks like it worked, but something broke between systems.
Tracing includes 3 things:
Time for each function
What functions were involved
The components with which it interacts with
For an e-commerce store, the order was processed. The customer paid. However, the inventory did not update. The shipping step never started. When a request moves through systems like Shopify, Air Table, or CRM, you trace the full spot and see where it failed or got stuck.
Tracing plays a key role in enhancing the user experience as it involves retracing a sequence of events that lead to an issue and affect the user's experience.
Tools like Jagear and Telemetry are used for capturing and visualizing traces. Unlike application monitoring, distributed tracing goes deeper than just assessing the performance.
It focuses on how different requests flow across services and how each component in an application responds to a request.
Then, How Are Logs Different From Traces?
Logs can be a good data source for telling what happened and when something happened inside the application or software. But it can't tell you the full story.
You checked the system log, and it tells you that the email has failed to be sent. But unlike tracing, logging can't tell you why the system was trying to send an email and from where the email originates.
Tracing can visualize the flow of operations throughout the system. It tells which service triggered an email service that the system throws an error. How was the event going?
Tracing works in such a way by adding a unique tracing ID that goes along the application. It's like a unique ID assigned to each transaction that spans the entire flow from start to end.
The ultimate objective of tracing is to identify bottlenecks associated with an application.
Though analyzing logs can give you an overview of how applications function, it fails to track how various applications interact.
Tracing covers everything, including how your data moves through the entire system, which helps the developers to analyze the deviations, if any. Tracing proves to be a worthy action to find out the bugs faster.
What Are The Benefits of Tracing Observability?
Pinpointing slow database queries during a transaction
Debugging inter-service communication in cloud-native environments
Doing root cause analysis between services, interactions with databases, or how they affect response times.
Used for systems that require real-time performance tracking, such as vehicle control systems and healthcare systems.
In What Situation Should You Choose Logging, Monitoring, or Tracing?
All three components are important pillars of observability.
Logging should be enabled in every system as it's the first level for finding the error and RCA from the logs for the issue arising.
System monitoring through visualized dashboards simplifies metric analysis and helps identify system spikes and performance issues.
In modern Mirco-service architecture, where finding the potential issue is difficult, (100 microservices are running), here comes the picture Traces, which exactly finds the blocker of the request. At which service is the request getting stuck?
This not only saves a lot of time debugging the issue but also helps resolve the issue quickly.
How Can BigOhTech Help You Automate Your Old Infrastructure & Make Faster Software Releases?
Logging tells you what happened; monitoring tells you how and when it happens, and tracing tells you where and why across systems.
But for gaining better visibility into infrastructure, consider following these practices when doing logging, tracing or monitoring-
Keep logs, traces and metrics in a single platform.
Observability is never a one-and-done phase. You need to constantly check your strategy, get feedback, and set your systems early on.
At BigOhTech, observability is also crucial for the entire system, as without debugging the error, it is not possible to resolve it.
As a DevOps consulting firm, we provide you access to certified DevOps engineers who will set up end-to-end observability of the entire infrastructure and application with all the latest tools and technologies for logging, monitoring and tracing.
We recently helped Lufthansa Airlines in reducing their cloud cost for their fly Docs platform. The client experienced a month-on-month increment in cloud cost of 7-9%.
We conducted an infrastructure audit and then provided them with a roadmap to help them improve their cloud cost without affecting their current architecture. Want to know more about what results we brought? Read this case study here.
FAQs
Q1) Can tracing replace logging?
No, logging cannot be fully replaceable by tracing. Logging is the process of recording events of an application. Logging provides detailed insights into the events that occur within an application.
On the contrary, tracing refers to the process of recording the path and events that occur within the system. Tracing provides a deep level of architecture.
Q2) What does trace mean in logging?
Trace refers to the detailed record of an application. Trace in logging is used to identify the performance bottlenecks.