While traditional application monitoring techniques have supported the software lifecycle for decades, automated APM tools have streamlined the practice and made it even more efficient.
DevOps teams utilize automated APM tools to receive alerts and notifications more quickly, enabling them to resolve performance issues before they impact the end-user experience. Thus, these tools enhance the effectiveness of the entire application monitoring process.
Before we dive into application performance management tools and some of the best APM tools available in the market, let’s understand what application performance monitoring is and how it benefits a business.
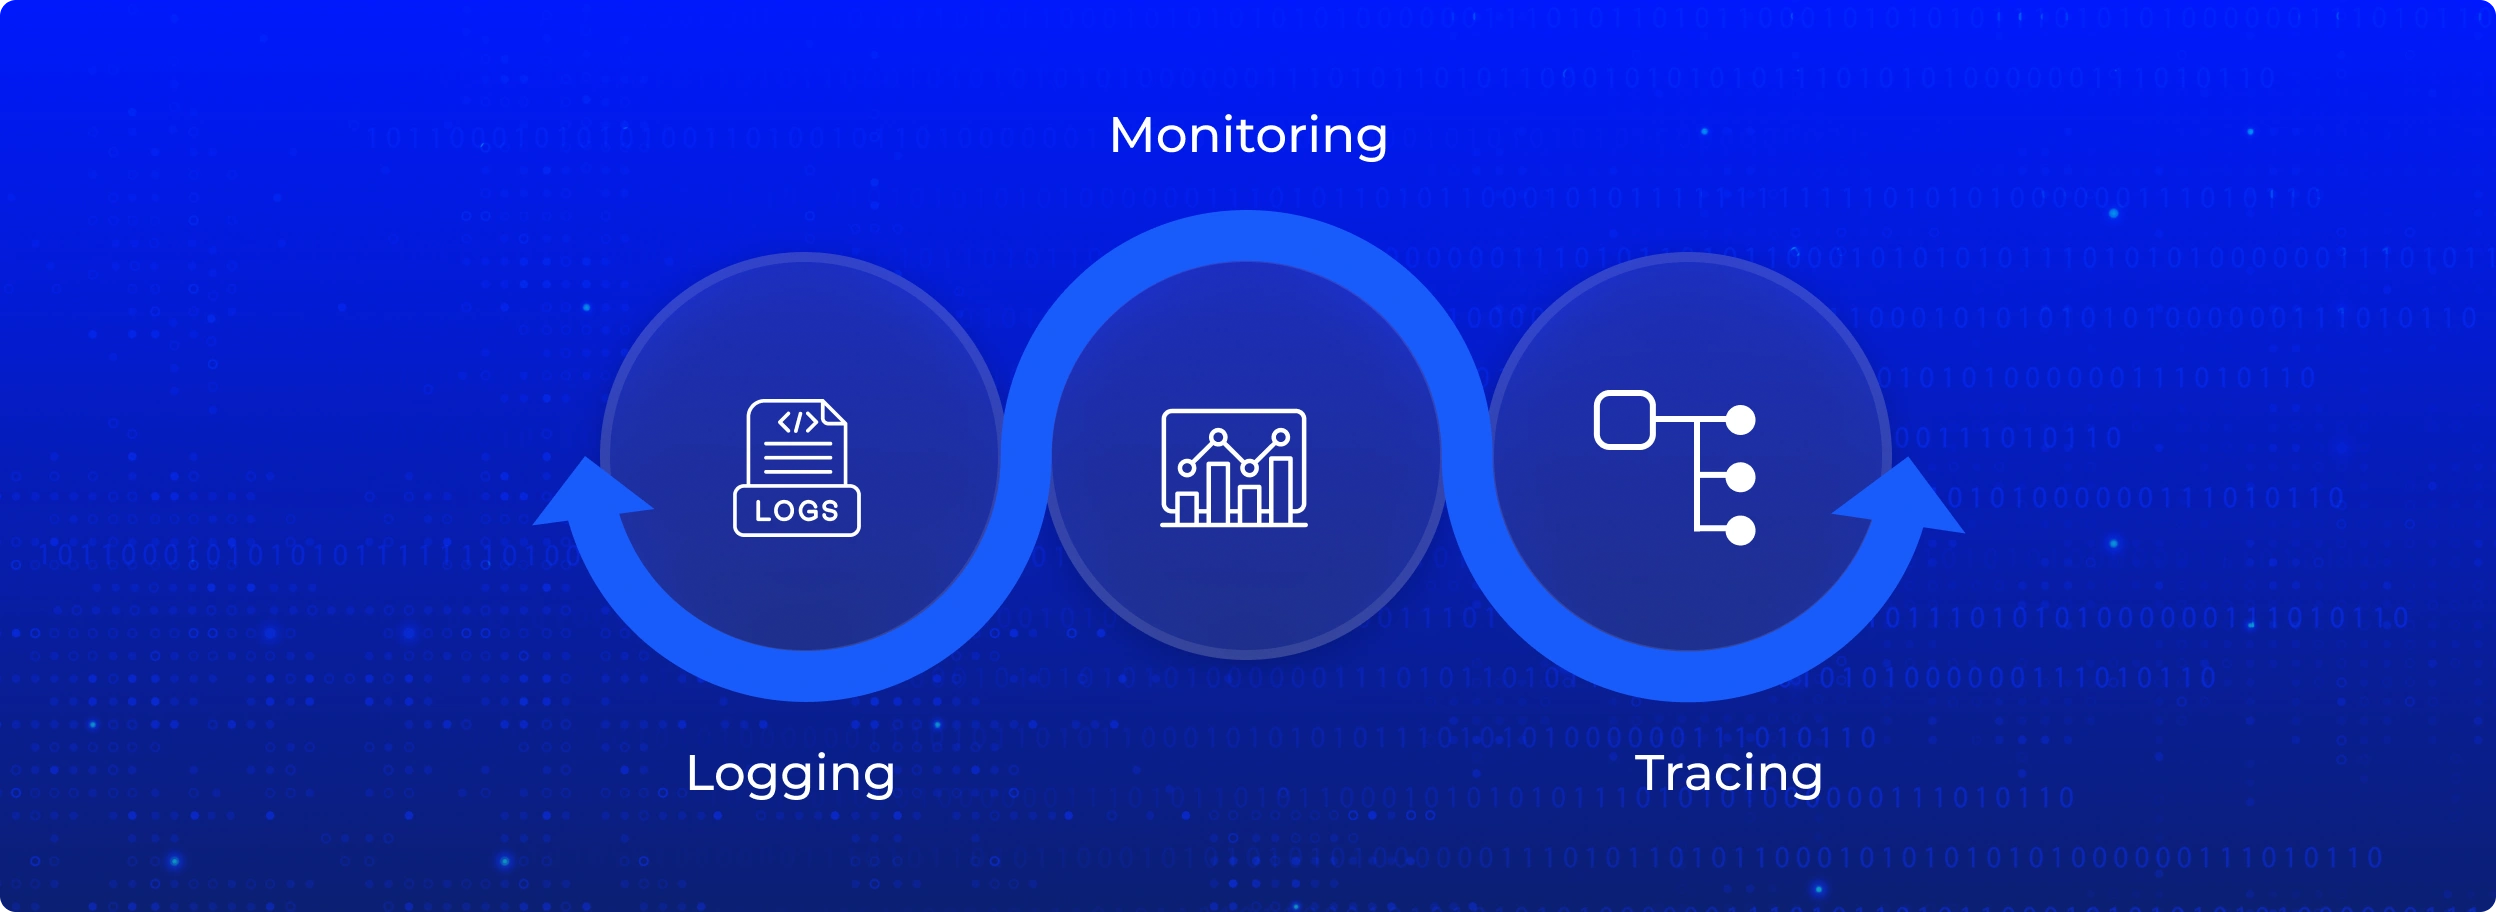
The software development lifecycle has always included application monitoring as a component. Moreover, under application monitoring, a business monitors its entire application as a whole. This practice allows DevOps teams to track metrics and understand overall application availability and response time. To gain deeper insights into the role of monitoring in DevOps, check out our guide on monitoring tools in DevOps.
While application monitoring has been a strong pillar of software development and deployment, the practice only monitors surface-level events of an application. Therefore, DevOps teams have adopted various other practices to complement application monitoring techniques. Tracing is one such practice.
Tracing allows DevOps teams to track the data progression and also the program flow of an application. In addition, it offers insights into complex distributed software environments.
The majority of DevOps teams employ application monitoring techniques and use tracing for a more granular understanding of the application performance, whenever an issue arises.
Therefore, we will look at the benefits of application monitoring, and the tools used for such monitoring practice in the next sections of this blog.
Some key benefits of application monitoring in DevOps are:
For example, Alaska Airlines wanted to gather insights that would help them bring costly performance issues down. So, Alaska Airlines went with the APM solution. It allowed the company to derive a holistic view of its ecosystem and also understand and target the root causes of issues. As a result, the company experienced a 60% reduction in outages, and MTTR went down from an hour to 10 mins.
Since application performance monitoring has extensive benefits, the practice has been in use for many decades. However, traditional application monitoring ways were not as efficient and fruit-bearing as the new ways that include the usage of tools.
In the past, PING testing was traditionally employed for application performance monitoring, which posed challenges as it required running tests to identify performance bottlenecks or bugs. This limitation resulted in compromised application performance during off-hours, leading to inconvenience for businesses and users.
That’s why automated application monitoring tools came into existence, to give what the traditional ways lacked. APM tools modernized the way application monitoring is done, enhancing the efficiency and also productivity of the whole process and application as a whole.
Some features make an application performance monitoring tool more effective. These essential and top features are:
These were some of the desired characteristics of an application performance management tools. These features allow a tool to efficiently monitor an application’s performance, thereby covering all the intended aspects.
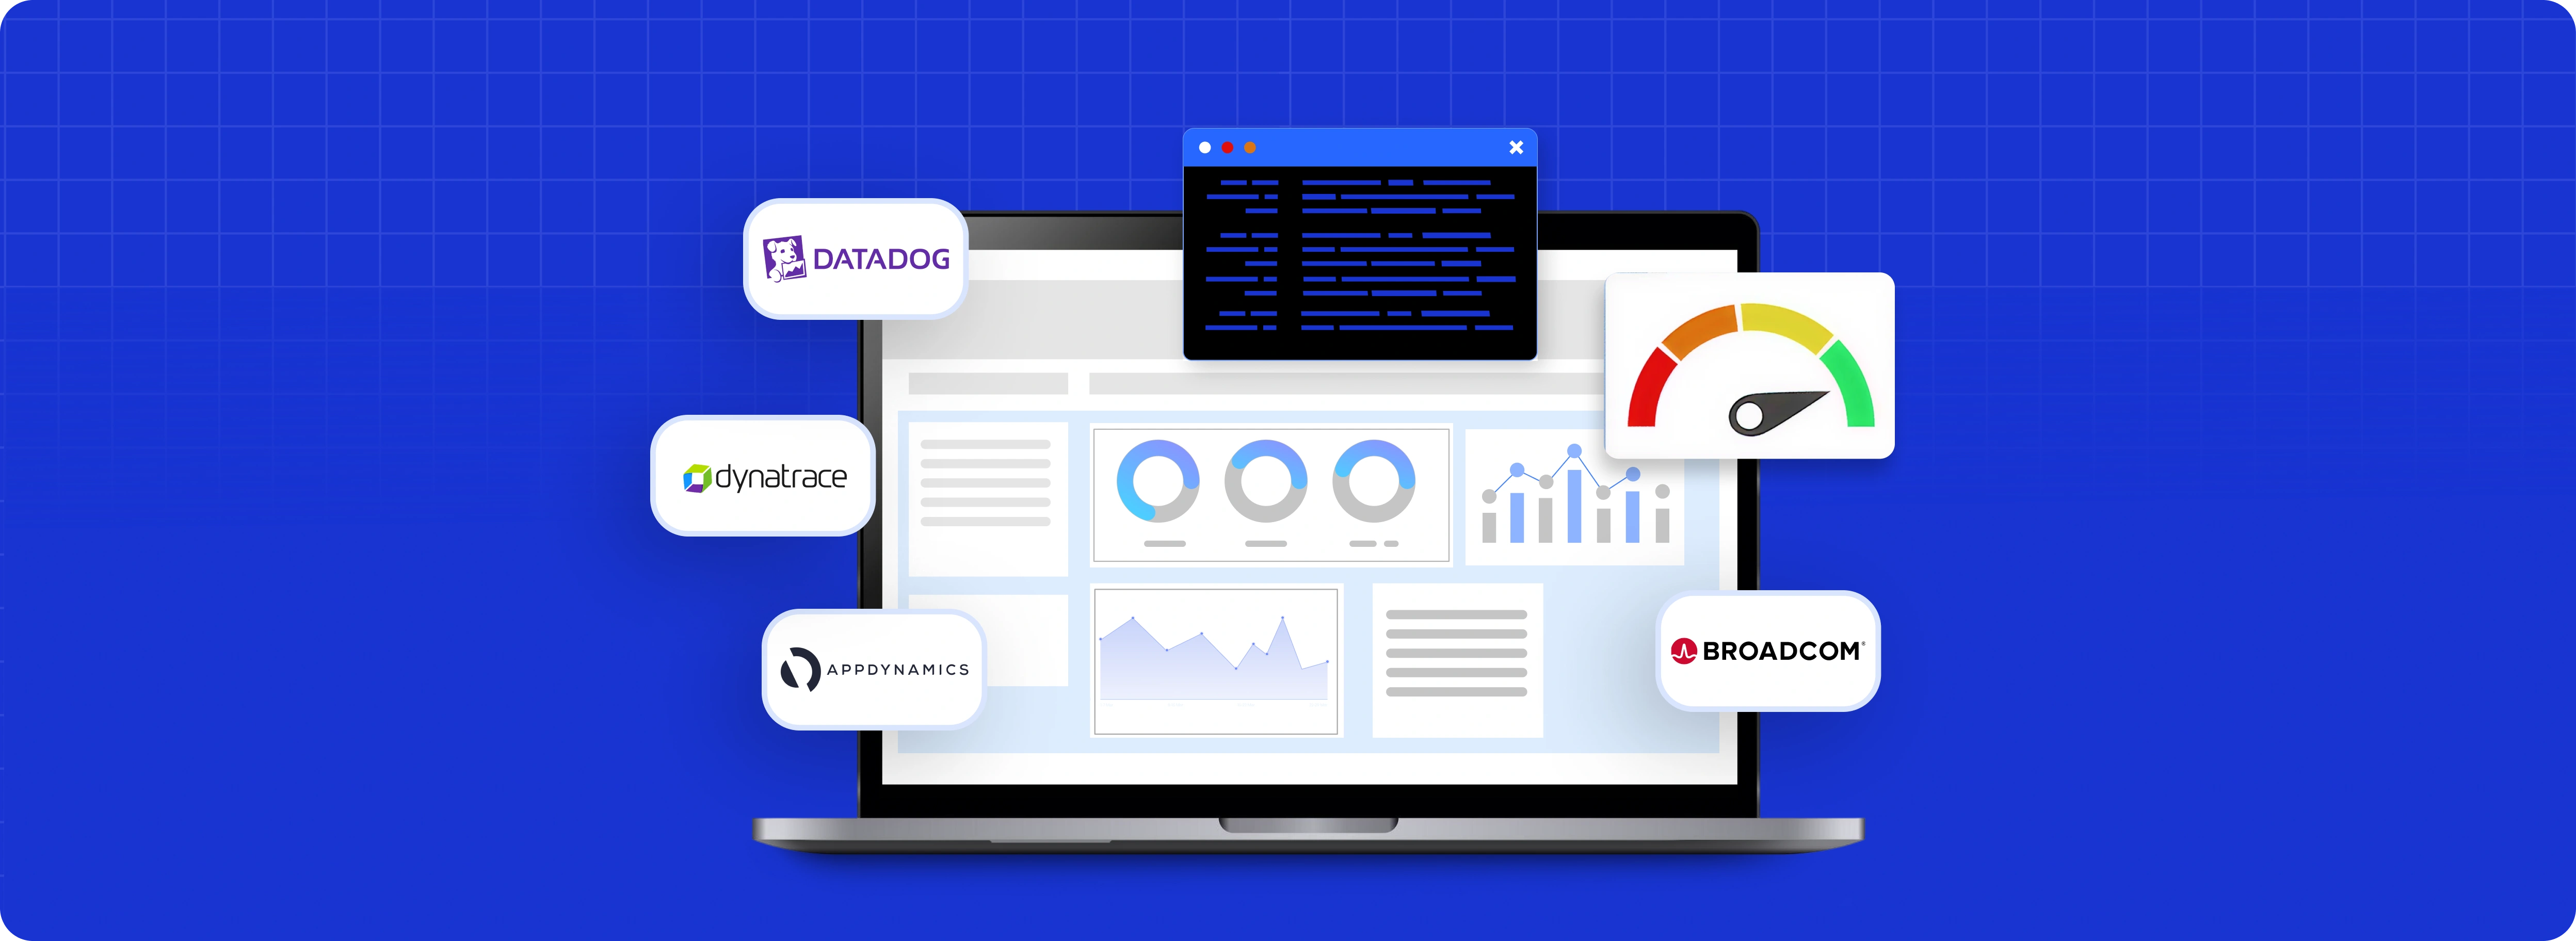
Let’s now look at the top application performance monitoring tools and help a business choose the one that best fits its needs.
DataDog offers cloud-based application performance monitoring services. This tool facilitates distributed tracing and code profiling.
Founded in 2010, it enables users to analyze and also monitor dependencies and remove performance bottlenecks. This tool further helps teams to reduce latency, track errors, and enhance code efficiency to optimize an application.
It provides live root-cause analysis to bring down resolution time and in addition, facilitate faster release of features. This tool supports some of the most popular web frameworks such as Django, Ruby on Rails, Gin, and Spring.
Let’s look at the pros and cons of the DataDog APM tool as well as the pricing system.
Launched in 2006, Dynatrace is touted as the first self-learning APM tool. It monitors and manages the performance as well as ensures the availability of the software application. Furthermore, performance issues are discovered using artificial intelligence (AI).
Dynatrace APM monitors all individual as well as business transactions along with capturing their timing, across every tier, at the code level thoroughly.
This tool supports programming languages like .NET and Java.
This tool automatically discovers and monitors microservices running within containers; helps teams to analyze their performance and detect poorly performing microservices right away. It is a SaaS or On-premise tool.
AppDynamics is an application performance management company based out of the USA, that started as an independent firm in 2008 but was later acquired by Cisco Systems in 2018. It caters to large enterprises and offers them SaaS as well as on–premise application performance monitoring services.
This tool provides insights and great visibility into application performance, helping teams to identify bottlenecks, bugs, and other issues on time. It facilitates end-to-end transaction tracing and gives code-level visibility. Furthermore, it offers dynamic baselining and alerting services.
AppDynamics APM tool supports programming languages like .NET, Java, PHP, C++, Python, Node.js
It enables teams to identify and fix root-cause analysis efficiently. Gartner recognized AppDynamics as a leader in the APM market for more than 8 years and was positioned highest in ‘ability to execute’ in Gartner’s 2021 Magic Quadrant Report for APM.
Let’s see how this tool is beneficial and what are its disadvantages as well as how is it priced.
Broadcom DX APM is a monitoring platform that comprises small microservices, allowing individual scalability and performance enhancement. It monitors user activity to identify performance shortfalls in an application.
Broadcom’s transaction tracer builds up a map of application components and service dependencies. It also gives visibility into database performance. Moreover, graphs of application delivery performance over time are prepared to spot any irregularities or deviations.
With this tool, alert thresholds are fine-tuned by ML so that non-essential alerts do not overwhelm a user and have an impact on its day-to-day activities.
Founded in 2006, Site 24×7 is a cloud-based application performance monitoring tool. One of the best APM tools in the market, Site 24×7 allows users to analyze the performance of an application running on multiple platforms like Java, Node.js, Ruby, PHP, and .NET.
Administered remotely, this tool is capable of analyzing applications running on any platform, including on both, cloud servers and mobile devices. Capable of discovering all of your software and tracking different modules that support them, this tool creates an application dependency map.
The performance analyzing capabilities of this tool extends to databases. Supporting services causing the slowdown of the system can be identified. Live metrics on transaction data and reports for multiple periods can also be viewed with this tool.
Integration of emerging technologies like AI and ML allows users as well as the site to set desired or suitable levels of alert thresholds.
Let’s understand the pros and cons of this tool along with its pricing options.
This is a full-stack observability tool that allows businesses to monitor and trace dependencies across their different, distributed apps. It can help them detect anomalies, correct errors, optimize app performance, and ultimately enhance customer experience.
New Relic APM allows businesses to have greater visibility into the application stack. They can monitor back-end APIs to the user devices, allowing cross-functional teams to prevent issues, and debug faster, as well as remove monitoring gaps with data recommendations.
Some of the performance metrics include response time, error rate, transaction breakdown, cross-application tracing, etc.
The languages supported by this tool are .NET, Java, Ruby, Python, Nodejs, Go, and PHP. It offers over 600 integrations and WordPress-specific functionality. This feature allows you to keep tabs on WordPress plugins, themes, as well as hooks.
Let’s look at the pros and cons of this tool and its pricing options.
Pay-as-you-go pricing based on monthly data ingested and type of user (free, core, and full platform)
The three plans offered are:
Offered by Stackify and developed especially for developers, this tool is a SaaS-based solution that helps in the optimization of app performance in QA.
This lightweight code profiling ‘retraces’ app issues in production through in-depth code-level transaction traces. Retracing includes search and drill-down capabilities into server and app logs along with creating customized log queries for easy checking.
This platform compiles performance, log, error, and metric data to offer consolidated monitoring insights into production as well as preproduction environments.
It is a SaaS-based tool and offers support to languages such as .NET, .NET Core, and Java.
Two pricing plans are available:
ManageEngine Applications Manager offers a comprehensive tool that monitors every aspect of an app to detect issues. It empowers businesses to make informed decisions through data-driven app performance insights.
This applications manager runs code-level diagnostics for .NET, Java, and Ruby on Rails, apps. Supporting auto-discovery of an app’s topology, this tool presents visualized dependencies. Using Apdex Scores, it measures end-user satisfaction levels.
You can utilize this tool to monitor hybrid, virtual, cloud, as well as container technologies. It tracks middleware and messaging components and provides customizable reports and dashboards.
Let’s look at its pros, cons, and pricing options.
Two pricing models offered are:
This is an MIT- licensed, full-stack open-source APM solution that allows you to monitor logs, metrics, and traces. There is no need for vendor lock-in when you use this APM tool.
SigNoz utilizes ClickHouse, a single database for the backend, while the frontend is the frontend is Typescript-powered. It supports OpenTelemetry for instrumentation.
This tool displays multiple charts such as p90, error rates, and p99 latency for application metrics. Its ability to trace efficiently allows businesses to identify the root cause of issues.
Two pricing plans are offered:
Instana, an IBM solution, allows businesses to optimize performance through automatically contextualized observability data. It comes as SaaS or self-hosted software, which observes and monitors dependencies across the infrastructure.
Using stream processing to collect and analyze real-time data, this tool provides immediate feedback on app release, deployment, as well as version.
Now we will look at some pros, and cons as well as the pricing options for this tool.
There are many application-performing monitoring tools available in the market today to assist businesses with application monitoring. However, some features tell a tool apart and bring more efficiency to the monitoring process.
You should define your needs and choose the most suitable APM monitoring tool accordingly.
And if you are struggling to find the right tool, then we have got you covered!
Our DevOps service experts use the most suitable and latest tools to ensure your app runs faster than Usain Bolt!
Application monitoring tools facilitate tracking and monitoring various performance metrics of an application to identify issues and bugs. These automated tools help a developer to identify performance bottlenecks as they occur, in real-time and fix them, providing an enhanced user experience to the end-users. These best APM monitoring tools help a business to achieve its business goals and live up to its software delivery expectations.
Different APM tools do an excellent job of tracking application performance metrics. Application monitoring software/tools like DataDog, AppDynamics, Splunk, Site 24×7, SolarWinds AppOptics, Zabbix, etc., are all some of the top options in the market and possess different useful features. These tools should be chosen according to business needs.
APM or application performance monitoring is a practice that is an integral part of a software lifecycle. It allows teams to track metrics and monitor overall application availability and response time.