DevOps is a practice that involves monitoring and tracking various performance and security parameters of an app, among other things. In this blog, we would look at some DevOps monitoring tools that facilitate this practice.
DevOps Practices
Different DevOps practices help businesses leverage the power of DevOps methodologies. Some of the key practices are:
- Continuous Integration (CI)
- Continuous Deployment (CD)
- Microservices
- Infrastructure as code
- Monitoring and Logging
- Communication and Collaboration
All these practices make DevOps a successful endeavor. However, in this blog, we would particularly look at DevOps monitoring, what importance it holds in the DevOps process, and the tools used to monitor it.
Let’s start with a brief case study.
In 2021, popular sites like Amazon, The BBC, Reddit, eBay, the Financial Times, the Guardian, and the UK government website, suffered a mass outage and as a result, went offline for an hour.
But why?
Fastly, a content delivery network (CDN) provider for all the above-mentioned companies, was behind this major IT outage. Wondering about what caused it all?
Well, one of Fastly’s customers, performed a routine, valid configuration change that triggered a bug within the system, resulting in 85% of the network returning errors.
Sounds simple but it is much more complex in reality, and also avoidable. How?
By practicing DevOps monitoring through tools, outages like these could be avoided altogether or dealt with quickly and efficiently.

What Are DevOps Monitoring Tools?
DevOps monitoring is the practice of constantly monitoring the health and performance of applications and infrastructure to detect problems efficiently and correctly.
These tools in simpler terms, monitor different and important aspects of software, such as performance, health, availability, and security, in real-time and facilitate immediate action, when required.
Monitoring tools in DevOps collect data on a range of parameters, from CPU utilization to disk space to application response times, and identify and report the irregularities.
Since now we understand DevOps monitoring tools, let’s have a look at their significance in the software development lifecycle.
DevOps monitoring is a practice that happens for different aspects or types of development and infrastructure systems. For each type of monitoring, different tools facilitate the work.
Uses Of DevOps Monitoring Tools
There are many uses for DevOps monitoring tools. Some key uses are:
1. Improved development efficiency: DevOps monitoring tools enhance development efficiency by detecting potential issues or bugs prior to the release of code to production.
2. Tracks constant code changes: DevOps practices like CI/CD allow developers to make frequent changes to code. Moreover, with the introduction of a plethora of moving parts in a workflow through microservices and micro frontends, the probability of encountering issues increases.
Here the DevOps monitoring tools help by tracking changes made to the code and correcting any damage that was done to the user experience in real-time due to the same.
3. Enhances user experience: Since DevOps monitoring tools track user feedbacks all the time without fail, they notify about any new updates or changes made to the app or system. This improves customer experience.
4. Reduced system downtime: These tools further help to notify respective teams of any defects or anomalies if they occur, well in time before they hamper the user experience. This helps with reducing system downtime.
5. Identification of performance and security bottlenecks: DevOps monitoring also helps to track and identify performance bottlenecks and issues pertaining to security, costs, etc.
6. Root cause analysis: DevOps monitoring tools help to analyze metrics and logs and identify the root causes of the issues as quickly as possible.
7. Enhances collaboration through automation: DevOps practices can only be leveraged if the integration tools used in collaboration are efficient. An Atlassian DevOps study found that cooperation could hit the wall due to a lack of tool integration, which results in poor coordination among various teams.
These tools also facilitate smooth collaboration and agile responses.
Let’s now look at different types of monitoring and the tools used for them.
Types Of Monitoring
There are 4 types of monitoring in DevOps. They are as follows:
1. Log Monitoring:
As cloud-based services and microservices architecture are becoming more popular, common, and sophisticated, DevOps has more systems and hence, more logs and log data to manage.
DevOps monitoring teams oversee and manage log collection, aggregation, parsing, storage, analysis, search, archiving, and disposal. This data is then used for troubleshooting and gathering business insights. Compliance and security of applications and infrastructure are ensured during the whole process.
Developers monitor the behavior of applications before their release to production in CI/CD pipelines and uncover potential and preventable issues before deployment and production.
Some tools used for log monitoring are:
- Papertrail
- Scalyr
- Logz.io
- Fluentd
2. Database Monitoring:
Redgate 2019 State of SQL Server Monitoring Report states that 73% of organizations currently deploy database changes multiple times per month, and 15% deploy multiple times per day, driven by DevOps.
Moreover, more and more businesses are shifting to cloud-based services in pursuit of solving performance issues. Looking at greater workloads and considering frequent changes made to the database, the systems would be more prone to human errors.
This is where Database DevOps monitoring plays an important role. It ensures that the database code is included in the same process as the development code. This further helps teams identify and well-organize the software development and release the application by identifying and solving a known issue i.e., database code changes.
Some of the tools used for Database Monitoring are:
- For log monitoring: Promtail
- For metric monitoring:
- Postgres exporter
- Mysqld exporter
- Mongodb exporter
3. Network Monitoring:
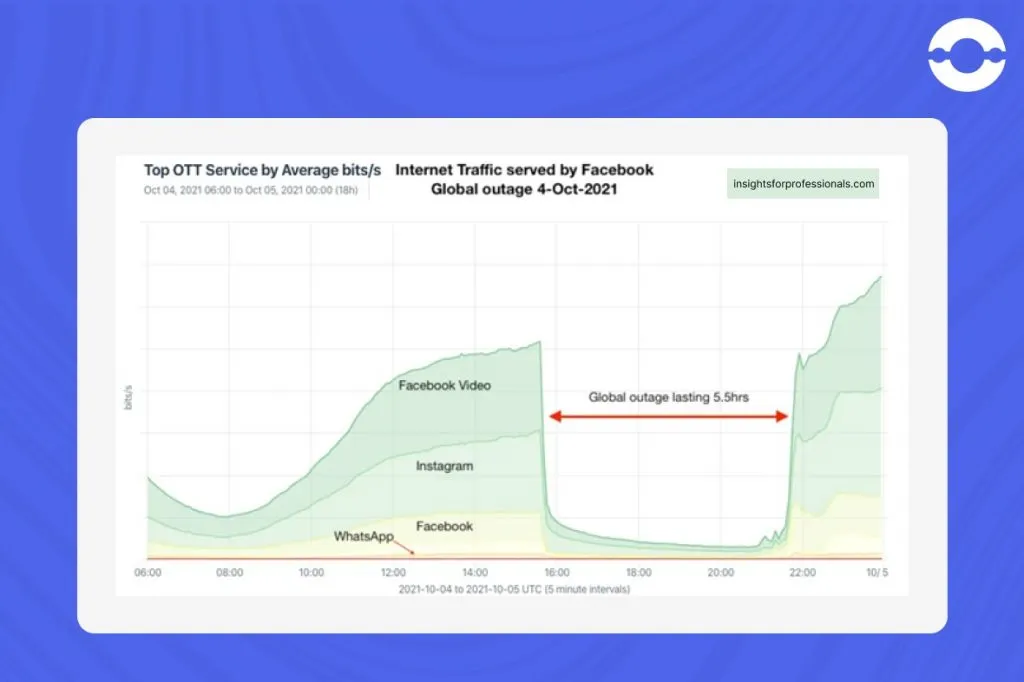
Facebook or Meta faced a widespread network outage back in 2021, that affected 3.5 billion users across its platforms for 5.5 hours. The cost to the company was around $60 million in lost advertising revenue, as well as the outage lowered its share value by 5%.
This example of an IT outage suffered by Facebook was a lesson in the importance of network monitoring.
A steady network is crucial for any software to work efficiently. To ensure a continuous, strong network, DevOps teams monitor the availability and performance of the network as well as its related components, through network performance monitoring or NPM. Teams evaluate servers, switches, routers, firewalls, and VMs to track the health of the network.
Various port-level metrics such as bandwidth, availability or uptime, and hardware failures are then used to identify issues with the network and correct them. Network flow logs are further used to identify any suspicious or malicious activities.
Some network monitoring tools are:
- Nagios
- Site24X7
- Zabbix
4. Application Performance Monitoring (APM):
Application performance monitoring in DevOps is a practice of searching, collecting, and centralizing logs with tracing and profiling present on the application. In simpler terms, the performance and availability of applications are tracked by APM.
This type of monitoring involves tracking user response times, and end-user experience through Real User Monitoring (RUM), identifying errors, etc.
Some APM tools are:
- DataDog
- Uptrends
- Splunk
The dashboard displays all the different types of monitoring in real-time through different monitoring UI tools, namely Grafana and Kibana.
Grafana and Kibana are open-source, data visualization tools that enable users to understand and analyze trends within huge amounts of logged data.
Data Visualization Tools For Monitoring
Let’s understand these two data visualization tools.
Grafana:
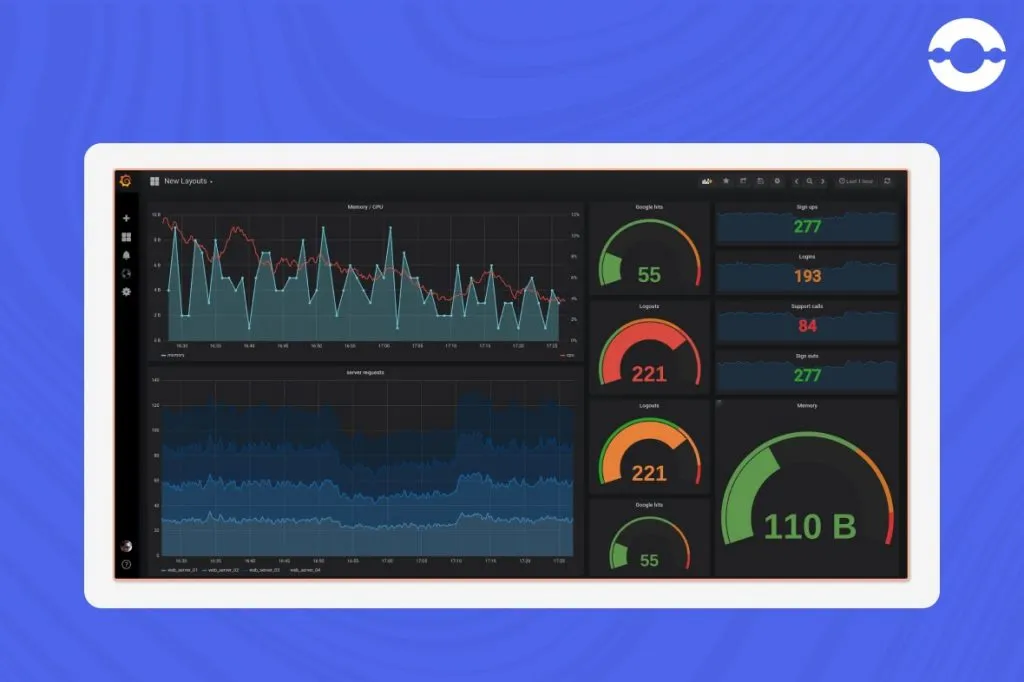
A team developed this multi-platform open-source, free-of-cost visualization tool in 2014. It is focused on monitoring tasks and is commonly used for visualizing metrics from time-series databases like InfluxDB, OpenTSDB, and Prometheus.
The data sources Grafana supports are those most commonly used for storing application metrics. Furthermore, the tool generates alerts in real-time which are displayed in its inbuilt dashboard.
Kibana:
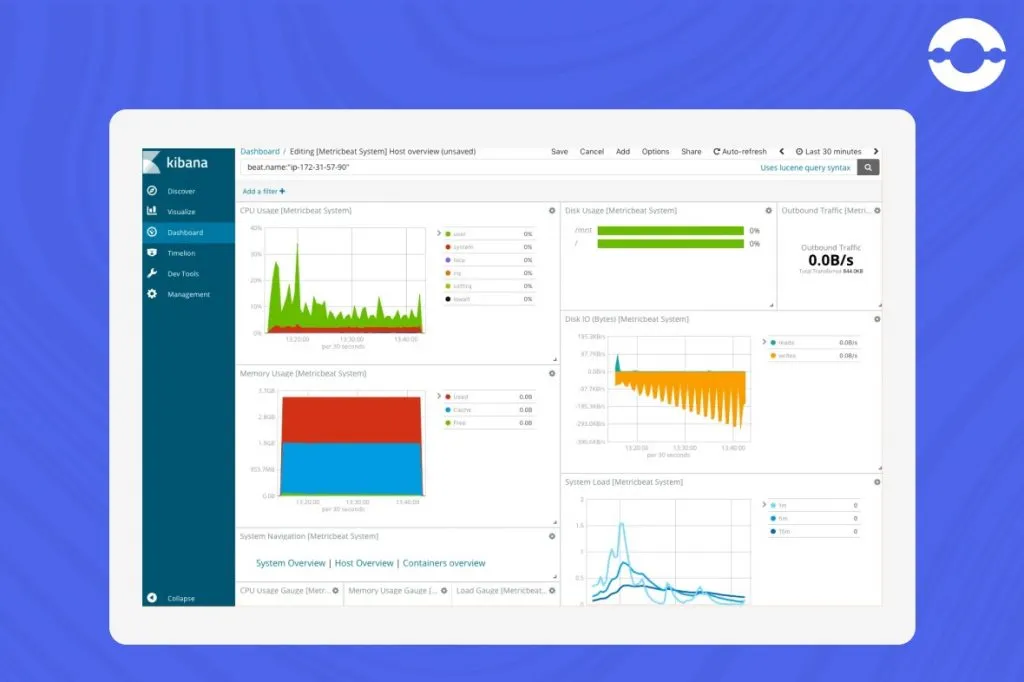
It is a part of the ELK Stack, which is the world’s most used open-source log analysis platform. It offers users a tool to explore, visualize, and develop dashboards in addition to the log data collected by Logstash and stored in Elasticsearch clusters.
Kibana was created in 2013 and is primarily used for data querying and analysis. Users can go through the required data indexed in Elasticsearch for particular events or strings within their data for root cause analysis and diagnostics. The generated data can be visualized in various different ways making use of charts, graphs and tables, geographical maps, etc.
These were the basics of the two data visualization tools. Differences between Grafana and Kibana should be understood before making a choice. Additionally, the choice between these two data visualization tools should be made according to the business and project requirements.
Importance of DevOps Monitoring Practices and Tools for Businesses
After looking at what all DevOps monitoring can offer, it is a no-brainer that every business dealing in software development should practice monitoring. It helps to identify bugs and issues in a timely manner, tracks app performance and health, helps a business streamline its software development lifecycle, and gathers customer feedback and insights, all with various powerful tools.
All these factors enhance the performance of an app, and fix any issue as and when it arises, reducing the bounce rate and hence the business revenue and repeat business.
DevOps monitoring boosts customer satisfaction and business numbers, and the monitoring tools facilitate this fruitful practice.
How can Big Oh help?
Big Oh Tech is an IT Consulting, Product development, and Staff augmentation company. We are adept at DevOps practices. Its highly skilled and dedicated teams of DevOps experts can assist you with your DevOps strategies and practices through our staff augmentation services.
Book a consultation today!
FAQs:
Q1. What are the types of monitoring in DevOps?
There are 4 types of monitoring in DevOps. These are:
1. Log monitoring
2. Database monitoring
3. Network monitoring
4. Application monitoring
Q2. Are DevOps monitoring tools free to use?
There are two types of monitoring tools, one that is free tools and the others that are paid tools.
Q3. How do you monitor performance through DevOps tools?
The performance of an application is monitored through Application Performance Monitoring (APM) tools in DevOps.
These tools offer measurement of performance parameters like availability, error rate, throughput, customer response time, slow pages, page loads, etc.
Q4. What are some commonly used monitoring tools in a DevOps environment?
Some commonly used DevOps monitoring tools are Grafana, Kibana, Datadog, Uptrends, Promtail, Nagios, etc.
Q5. What are the key features to look for in a monitoring tool for DevOps purposes?
All commonly used Monitoring tools have a few key features in common such as
Key features should be a minimal footprint to set up the tool, Ease to integrate, and be able to monitor and analyze the heartbeat of the application almost real-time
1. Able to quickly scale up/down as per the traffic
2. Rich Dashboard and visualization to understand and analyze systems performance
3. Easy to Integrate with other DevOps tools
4. Comply with Compliance and security guidelines
5. ML: Able to identify trends before an issue happens
Q6. What are the benefits of using monitoring tools in a DevOps environment?
The advantages of using DevOps monitoring tools are:
1. More visibility of code changes
2. Enhanced customer experience
3. Identification of bugs and issues
4. Reduced system downtime
5. Improved collaboration
Also Read: Top 10 Programming Languages